How Outdated Paperwork and Spreadsheets Are Quietly Draining Nonprofit Budgets
For many nonprofit teams, the day starts with a familiar ritual. You open a shared drive, hunt for the correct version of a file, and realize three people have been editing the same spreadsheet simultaneously. Then comes the data entry: copying client names from intake forms into a master list, manually calculating assistance amounts, and double-checking that the numbers in column C match the totals in column D.
It feels manageable when you are a small team. But as your organization grows, that "manageable" administrative overhead becomes a silent budget killer.
You might not realize it yet, but the cost of your current workflow is far higher than just staff hours. It is hiding in missed funder reporting deadlines, duplicated services for vulnerable clients, and the frustration of talented staff who feel they are data clerks rather than changemakers.
This article breaks down exactly where those hidden costs live and how to identify if your current tools are holding your mission back.
The True Cost of "Free" Tools
Most nonprofits do not start with expensive enterprise software. You start with what is accessible: Google Sheets, Excel, or paper clipboards. These tools have low upfront costs, which is why they are so common. However, they carry a high operational price tag that rarely appears on a budget sheet.
1. The Staff Time Tax
Every minute a case manager spends formatting a cell, fixing a broken formula, or searching for a missing document is a minute taken away from direct client support.
If five staff members spend just 30 minutes a week on manual data reconciliation, that is 2.5 hours of paid labor lost every single week. Over a year, that can be up to 130 hours. For a small nonprofit, this equates to thousands of dollars in salary costs that could otherwise fund program expansion or direct services. Many teams find they are wasting 20+ hours a week on admin instead of mission work without realizing the cumulative impact on their bottom line.
2. The Error Correction Cycle
Spreadsheets are fragile. A single misplaced decimal, an accidental deletion, or a version control error can corrupt months of data. When errors are discovered, staff must spend additional time tracing the source, correcting the data, and re-reporting. This cycle of error and correction is a direct drain on your operational budget.
3. The Opportunity Cost of Inaction
When your team is buried in administrative busywork, strategic initiatives stall. You cannot launch a new workshop series, apply for a major grant, or improve client outcomes if your leadership team is too exhausted from firefighting data issues to plan ahead.
How Fragmented Data Creates Duplicate Services
One of the most expensive inefficiencies in nonprofit work is duplicate service delivery. This happens when a client receives assistance from two different departments or staff members because the data is not connected.
Imagine a family visits your food pantry on Tuesday. Two days later, they visit your emergency shelter program. If these two programs are tracked in separate spreadsheets or siloed systems, neither staff member knows the other has already helped them.
This leads to:
- Wasted Resources: You spend money on food or shelter that was already provided.
- Client Frustration: Clients feel unheard and have to repeat their stories multiple times.
- Inaccurate Impact Reporting: Your total impact numbers are inflated because the same client is counted multiple times across different programs.
Without a single source of truth for each client, you are operating in the dark. You cannot see the full picture of a client's journey, nor can you accurately report to funders on unique individuals served versus total interactions. Understanding how duplicate client records are wasting nonprofit time and money is the first step toward fixing these systemic leaks.
The Reporting Nightmare That Drains Morale
End-of-quarter or end-of-year reporting is often the most dreaded time for nonprofit staff. If your data lives in spreadsheets, generating a report for a funder requires:
- Exporting data from multiple sources.
- Cleaning and formatting the data manually.
- Creating charts and graphs from scratch.
- Writing the narrative analysis.
This process can take days or even weeks. It often requires staff to work late nights and weekends, leading to burnout. Furthermore, the pressure to get the numbers "right" under a tight deadline increases the risk of errors in your public-facing reports, which can damage your organization's credibility with funders. Many leaders find themselves facing last-minute funder reporting nightmares because their data isn't structured for easy extraction.
Signs Your Current Workflow Is Broken
You may not realize how much your budget is being drained until you look for specific warning signs. Here are common indicators that your paperwork and spreadsheet reliance is costing you more than you think:
- Staff Turnover: Talented case managers leave because they are tired of administrative busywork instead of doing mission-driven work.
- Delayed Reporting: You consistently miss internal deadlines for leadership reviews because data compilation takes too long.
- Data Silos: Different departments refuse to share data because they do not trust the accuracy of the other team's spreadsheets.
- Client Complaints: Clients report having to fill out the same forms repeatedly or provide the same information to multiple staff members.
- Funder Questions: You receive requests for additional data clarification because your reports lack depth or consistency.
Moving From Reactive Admin to Proactive Impact
The solution is not necessarily to buy the most expensive software on the market. It is to adopt a system designed specifically for the realities of nonprofit case management.
The goal is to reduce the friction between intake and impact. When your tools are intuitive and connected, staff can log services in seconds rather than minutes. They can access a full client history instantly, preventing duplicates. And leadership can view real-time dashboards instead of waiting for end-of-month reports.
This shift requires a platform that prioritizes simplicity and speed. Tools that require extensive technical setup or complex training often fail because staff revert to spreadsheets when the new system feels too heavy.
Instead, look for a solution that integrates intake, service tracking, notes, and reporting into one clean interface. This allows your team to focus on the client, not the computer.
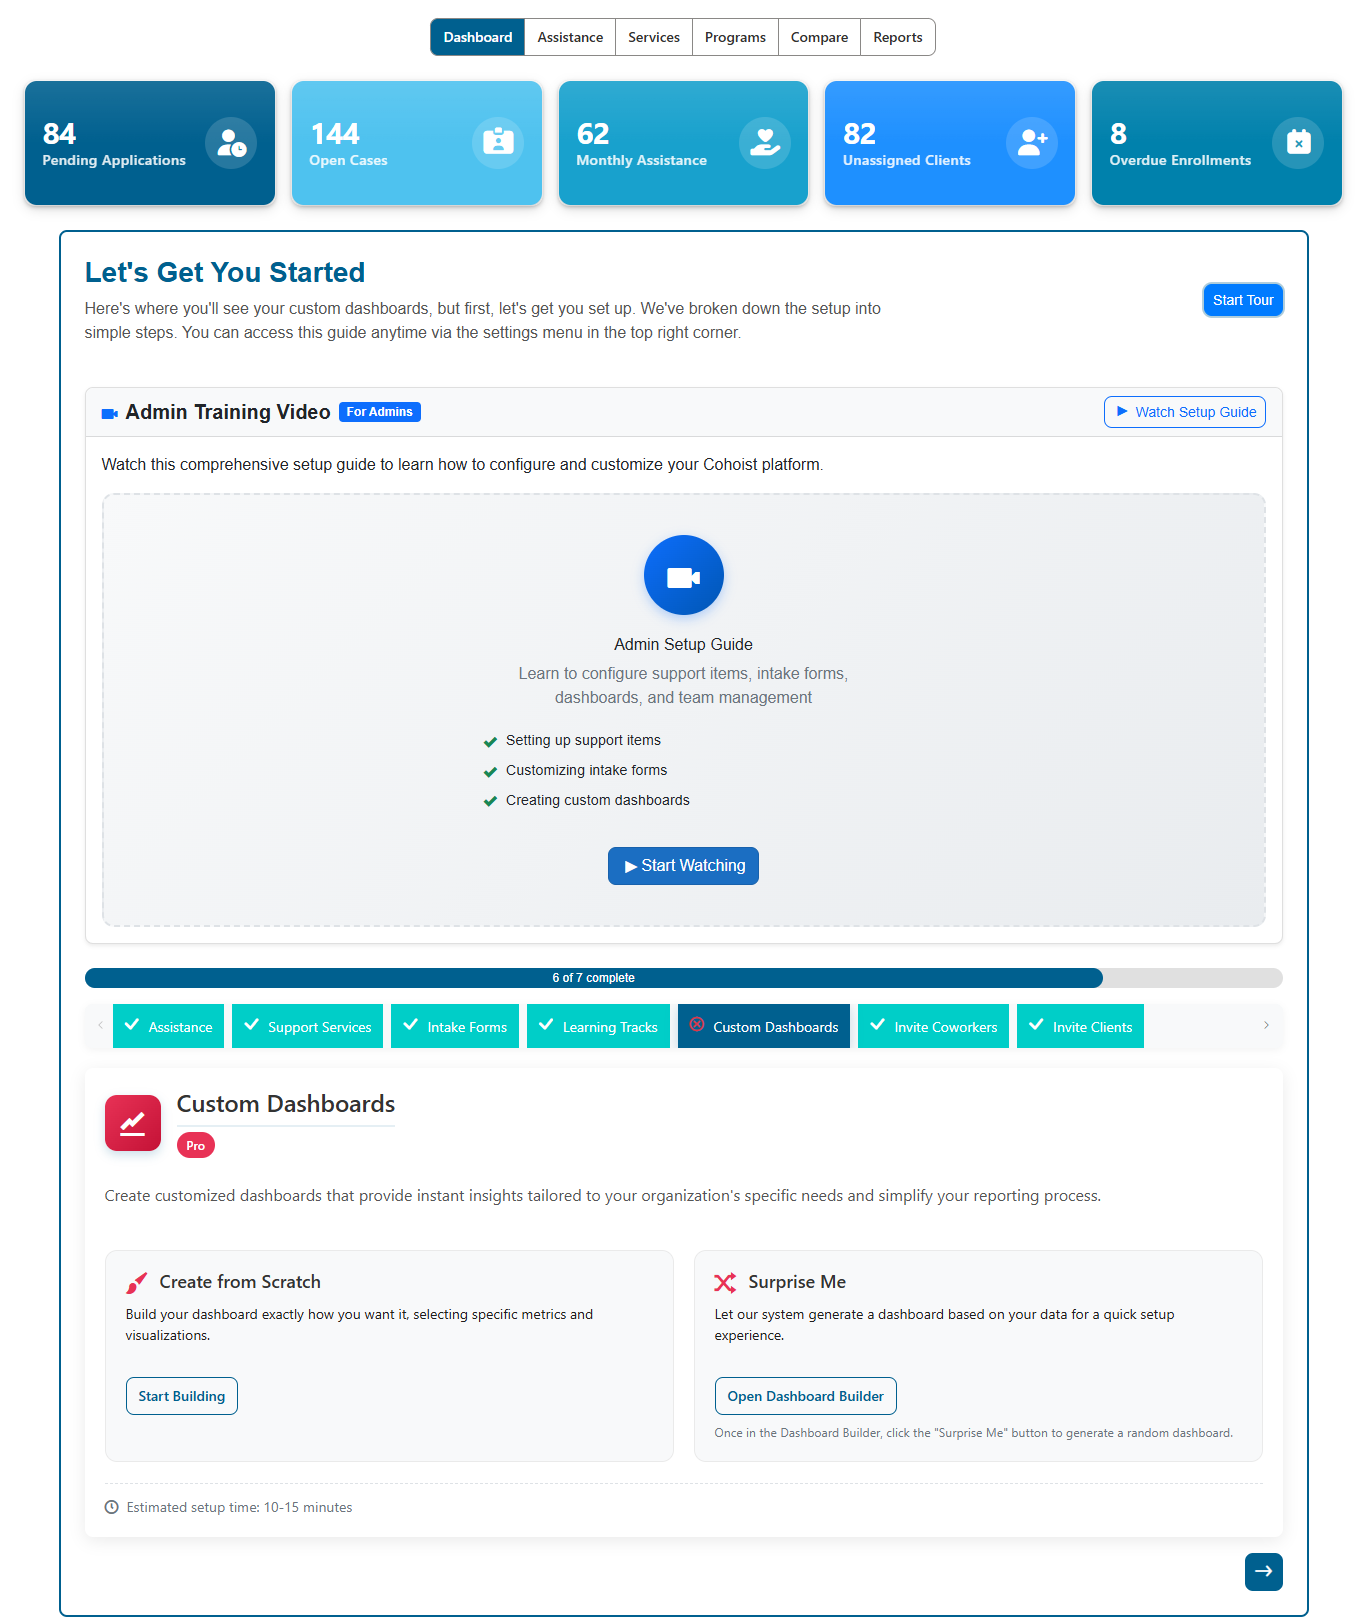
A modern platform should guide you through setup with clear, step-by-step progress trackers. As seen in the onboarding dashboard, you can see exactly what needs to be configured, from intake forms to custom dashboards. This reduces the time it takes to get your team up and running, ensuring you start seeing value from day one.
Automating the Busywork That Drains Your Budget
The most significant budget saver is automation. Every manual task you can remove from your workflow is a dollar you save in labor costs.
Consider common repetitive tasks:
- Sending follow-up emails after a service interaction.
- Enrolling clients in additional programs based on their intake answers.
- Generating weekly summary reports for leadership.
When these tasks are automated, they happen instantly and accurately in the background. This ensures nothing falls through the cracks and frees up your staff to focus on high-value activities.
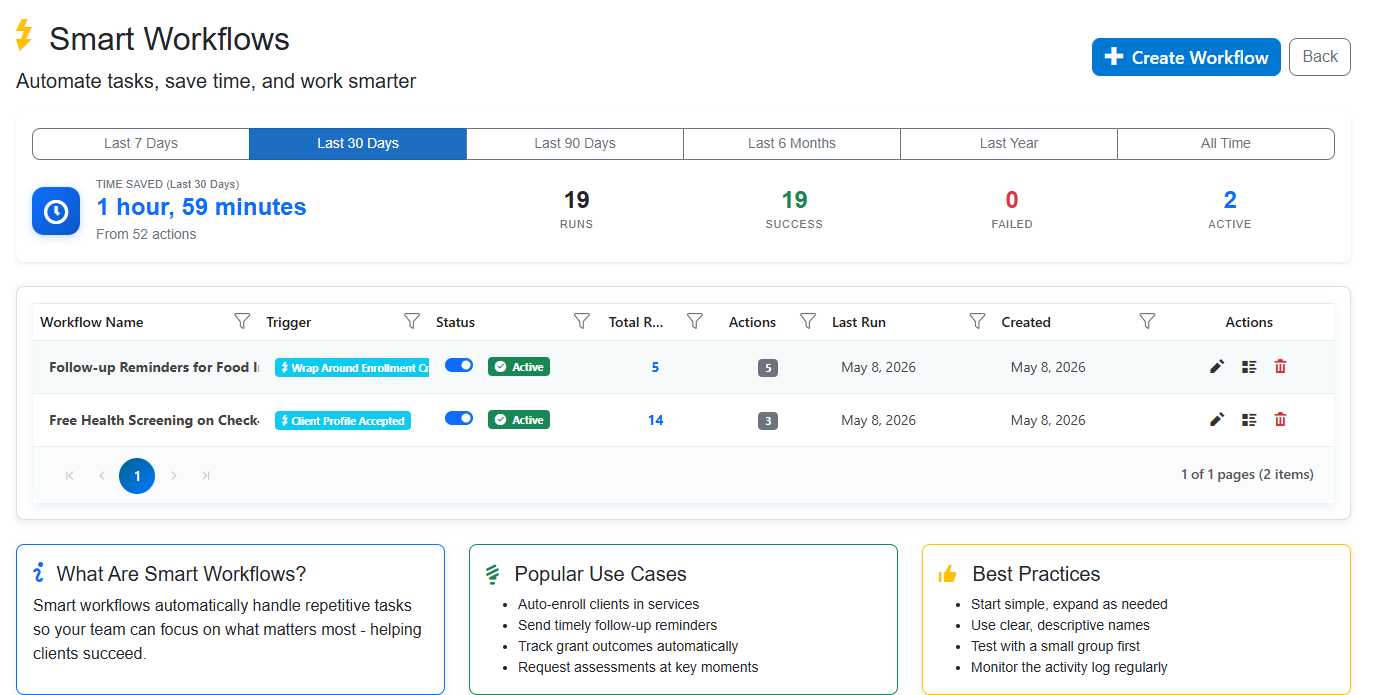
With smart workflows, you can track exactly how much time your automation is saving. The dashboard shows real-time metrics on runs, successes, and time saved, giving you tangible proof of efficiency gains. This visibility helps you justify the investment in better tools by showing direct returns in staff productivity.
Building Funder-Ready Reports Without the Stress
When your data is captured correctly at the point of service, reporting becomes a natural byproduct of your daily work rather than a separate, stressful project.
Modern case management platforms allow you to create custom reports and dashboards that update automatically. You can track outcomes, measure assistance values, and visualize demographics without writing a single formula.
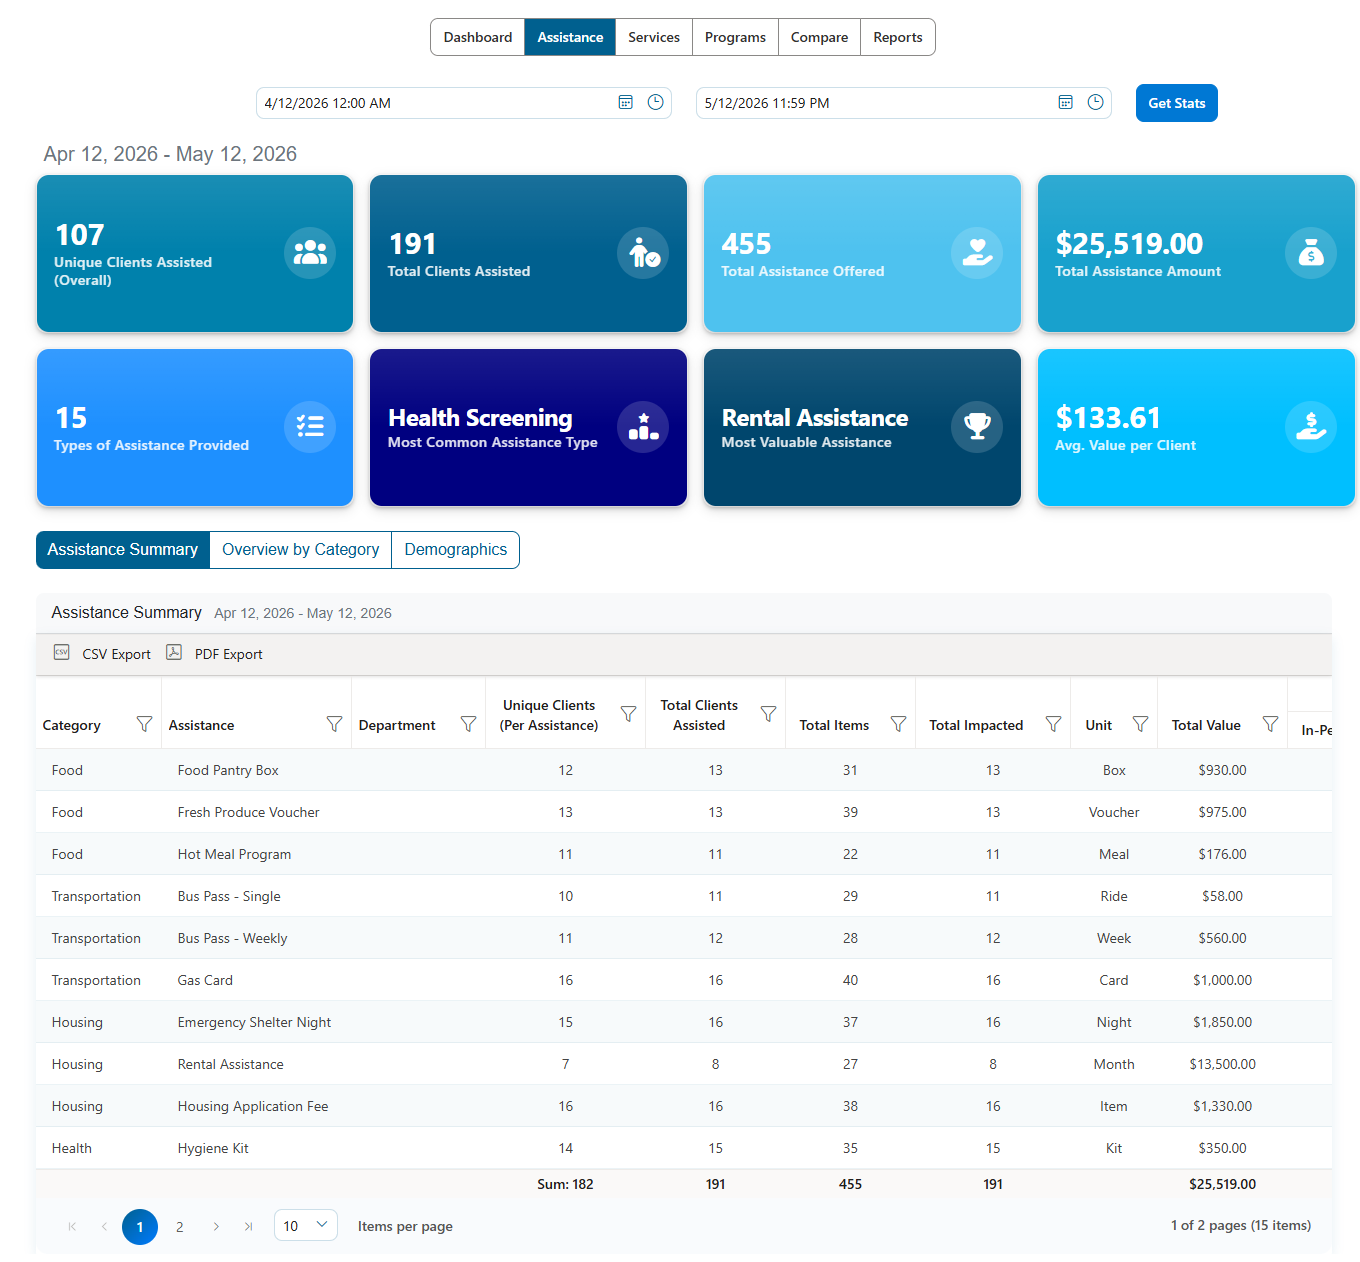
The assistance dashboard provides a clear view of your impact. You can see unique clients assisted, total assistance amounts, and the most common types of support provided. This data is ready to share with funders and stakeholders, demonstrating your organization's effectiveness with clarity and confidence.
Reclaiming Your Budget and Your Mission
Outdated paperwork and spreadsheets are not just inconvenient; they are expensive. They drain your budget through wasted staff time, duplicated services, and inefficient reporting processes.
By recognizing these hidden costs, you can take the first step toward a more efficient operation. The goal is to build a workflow that respects your staff's time, protects your client data, and clearly demonstrates your impact to funders.
If you are ready to stop letting administrative busywork drain your nonprofit's resources, it is time to explore a solution designed for your unique needs. Cohoist offers a refreshingly simple case management platform that helps you track services, automate workflows, and generate funder-ready reports with ease.
You can see how a streamlined approach works for your team by requesting a demo and watching a personalized walkthrough of the platform.
Ready to put this into practice?
Cohoist gives your team clean intake, fast service tracking, and funder-ready reports — without the clutter of traditional systems. See how simple it can be.