Nonprofit Outcome Tracking Made Simple: Tools That Turn Daily Casework Into Funder Reports
For many nonprofit teams, the gap between the work you do on the ground and the reports you submit to funders feels like a chasm. Your caseworkers are busy helping people, but the administrative burden of tracking every interaction, service, and outcome often falls on leadership or specialized data staff.
This disconnect creates two major problems. First, it delays your ability to show impact while the work is still fresh. Second, it forces your team to spend hours compiling data from disparate sources instead of focusing on client care.
Modern case management platforms bridge this gap automatically. These tools are designed to capture data at the point of service, turning daily activities into structured, funder-ready reports without the manual data entry that slows everyone down.
The Problem with Legacy Tracking Methods
Traditional approaches to outcome tracking often rely on spreadsheets, paper logs, or disjointed software systems. While these methods might have worked for small teams, they become fragile as your organization grows.
- Data Silos: Intake data lives in one place, wraparound support notes in another, and one-time assistance in a third. Connecting these dots for a single client story requires manual cross-referencing.
- Inconsistent Entry: Without standardized digital forms, staff members record data differently. One worker might log "Food Assistance" while another logs "Groceries," making aggregated reporting inaccurate. This becomes especially important for outcome tracking, where funders expect consistent metrics across all clients.
- Reporting Lag: Because data isn't centralized, generating a quarterly report for a grantor can take days or weeks of manual compilation, leaving little time for analysis or strategy.
When tracking is difficult, it's often skipped or done poorly. This leads to incomplete narratives about your impact and missed opportunities for renewal or expansion.
What Modern Outcome Tracking Looks Like
Effective outcome tracking tools shift the focus from collecting data to capturing it naturally. The best systems are built around the actual workflows of case managers, not the other way around.
1. Unified Client Profiles
Instead of searching through multiple files, a modern platform provides a single, shared view of each client. This includes their intake information, service history, notes, documents, and outcomes. When a caseworker logs a service, it immediately updates the client's permanent record.
The best case management platforms also allow you to link clients to specific grants or programs, making it easy to generate funder-specific reports.
2. Structured Service Logging
Tracking shouldn't feel like paperwork. Good tools use quick-entry workflows, dropdowns, and even barcode scanning for assistance items. This reduces the time spent on data entry from minutes to seconds, encouraging consistent and accurate logging.
Though important, service logging shouldn't be limited to just recording one-time assistance. You should be able to track ongoing support, including outcomes like improved employment status, housing stability, or educational attainment.
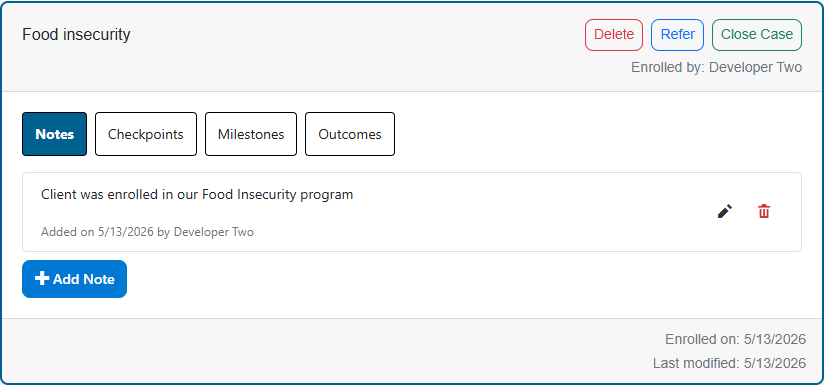
This simple view demonstrates how platforms handle complex, long-term support. Beyond basic check-ins, caseworkers can add detailed notes, track specific milestones, and manage checkpoints. Most importantly, caseworkers can record outcomes for each client. This structured approach ensures that every step of a client's journey is documented, providing the granular data needed for grant reporting and demonstrating sustained impact over time. Your organization moves beyond just logging services to capturing the full story of a client's progress, which is invaluable for funders looking to understand the effectiveness of your programs.
3. Automated Reporting
The most significant value lies in automation. Instead of manually pulling data for a grant report, the system aggregates metrics in real-time. Dashboards update automatically, highlighting key performance indicators like unique clients served, total assistance provided, and demographic trends.
If someone receives a specific service, the system can automatically track whether that service led to a positive outcome, such as securing housing or gaining employment. This allows your team to demonstrate impact with concrete data rather than anecdotal evidence.
Visualizing Impact with Dashboards
Dashboards are the bridge between raw data and strategic insight. They allow leadership to see the health of programs at a glance and provide stakeholders with clear, visual evidence of impact.
For example, an Assistance Dashboard can provide a high-level overview of your program's reach. It might display metric cards for "Unique Clients Assisted," "Total Assistance Amount," and "Avg. Value per Client," as in the screenshot below. Below these metrics, a detailed table breaks down assistance by category, such as "Food Pantry Box," "Emergency Shelter Night," or "Bus Pass."
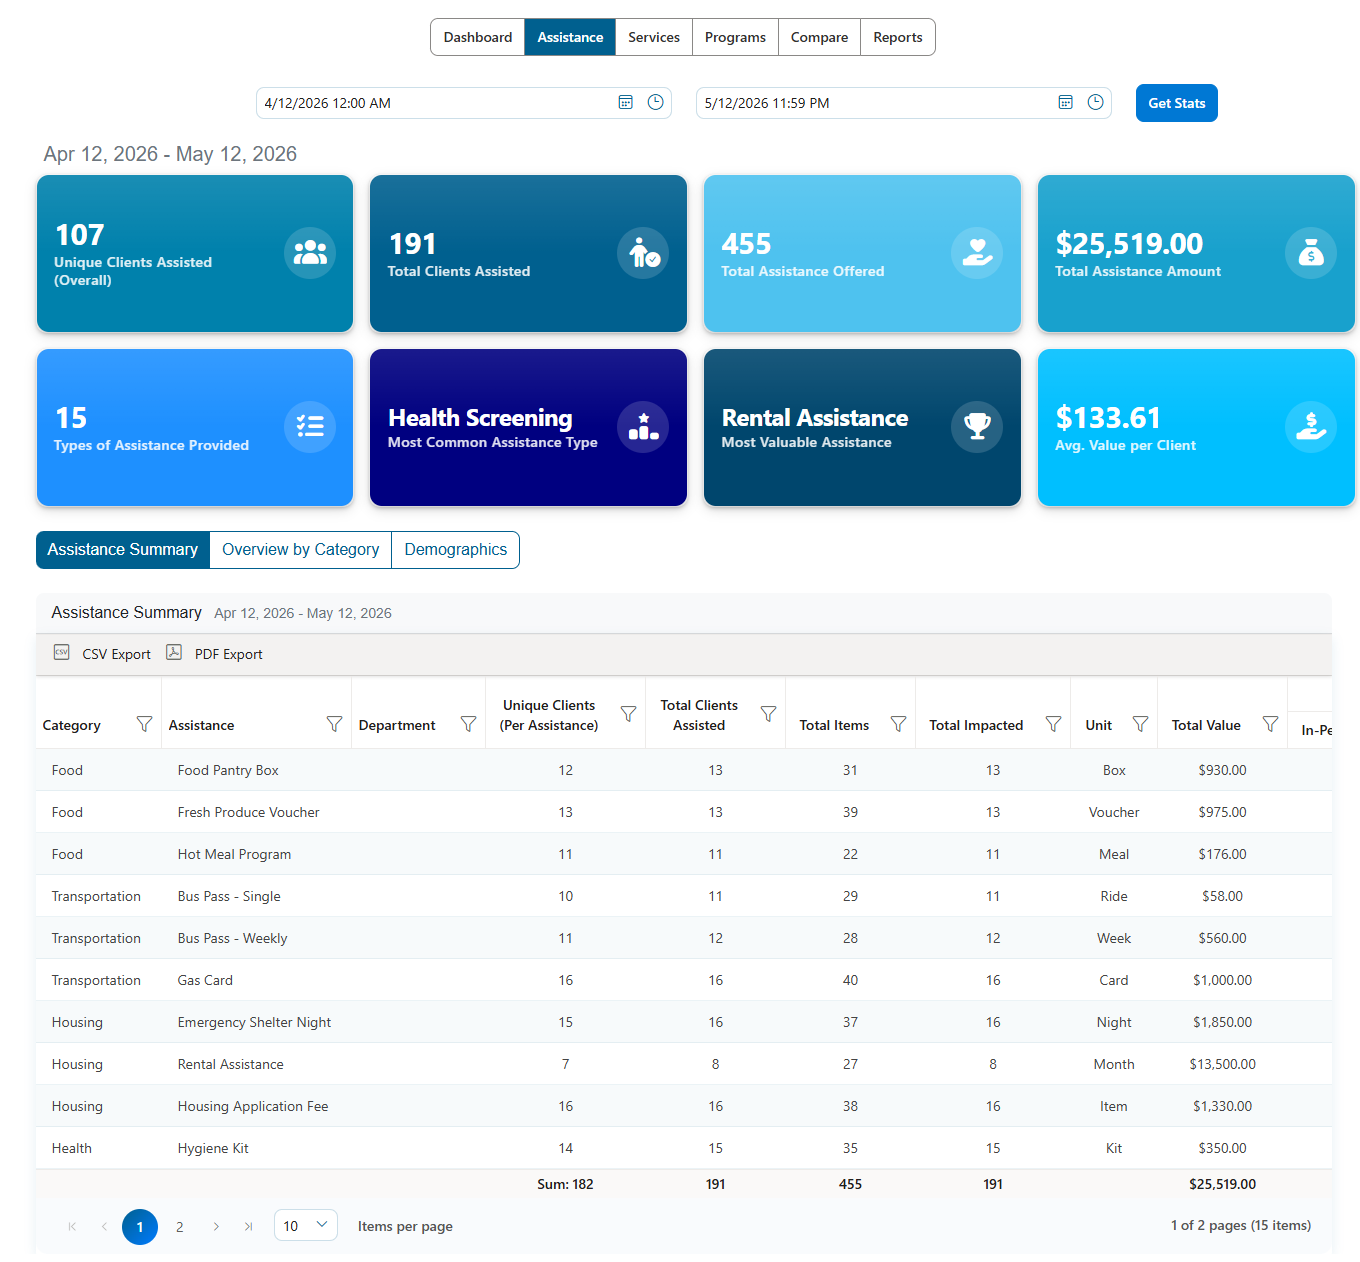
This type of visualization allows you to answer critical questions quickly:
- Which services are most in demand?
- How many unique individuals did we serve this month?
- What is the total monetary value of assistance provided?
By having this data readily available, you can move from reactive reporting to proactive program management. You can identify trends, allocate resources where they're needed most, and tell a compelling story about your organization's effectiveness.
Customizing Reports for Specific Funders
Not all funders want the same data. Some may focus on housing stability, while others prioritize employment outcomes. Rigid reporting tools force you to fit your data into their boxes. Flexible tools let you build reports that match their specific questions without having to export to Excel.
Modern platforms allow you to create custom dashboards and reports by selecting specific data sources, date ranges, and visualization types. You can choose between bar charts, pie charts, or value cards to best represent the data.
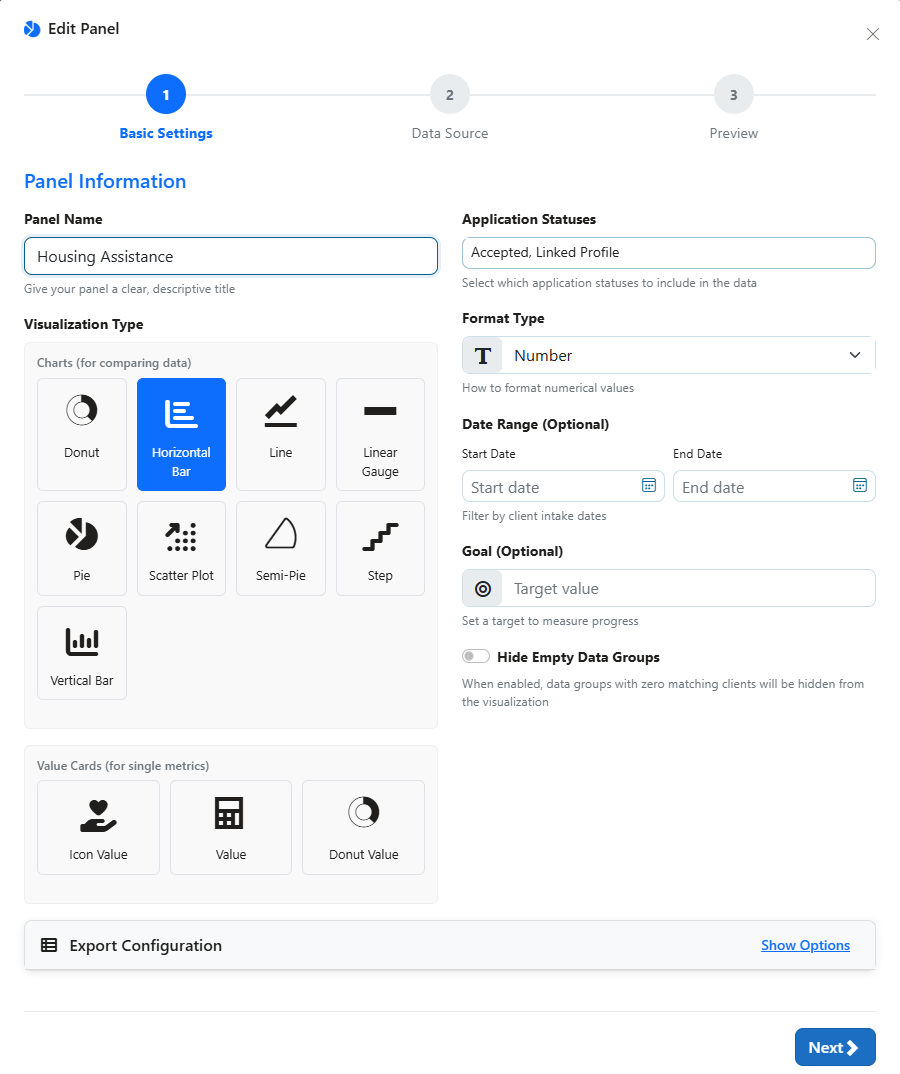
In the configuration panel for a report, you can define the panel name, select the visualization type (such as a horizontal bar chart), and filter data by specific application statuses or date ranges. This flexibility ensures that every report you generate is relevant, accurate, and tailored to the audience, whether it's a board member, a grantor, or an internal team.
Simplifying Report Creation with AI
Even with flexible tools, building complex reports from scratch can be time-consuming. This is where newer features like secure AI-powered report builders come into play. Instead of manually selecting fields and chart types, you can describe what you need in plain language.
For instance, you might type, "Show me a pie chart of clients by housing status." The system then generates the visualization for you, pulling from your available data resources like profile questions, programs, and outcomes.
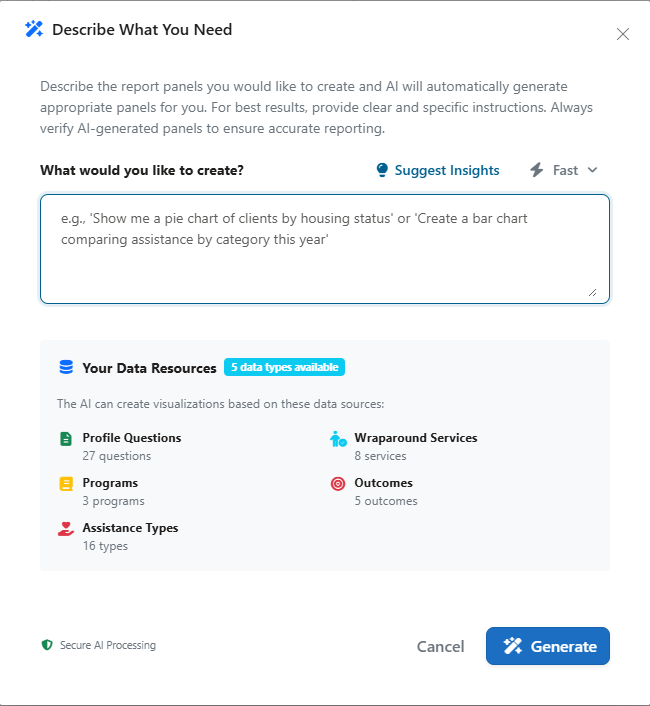
This approach democratizes data analysis. It allows caseworkers and program managers to get the insights they need without spending hours manually creating reports. It reduces the technical barrier to entry, making outcome tracking accessible to everyone on your team, which greatly improves adoption rates across the organization.
Choosing the Right Tool for Your Team
When evaluating case management software, look for features that prioritize ease of use and adoption. The best tool is the one your staff will actually use consistently.
- Intuitive Interface: A clean, modern design reduces training time and frustration.
- Mobile Accessibility: Staff should be able to log services and update records on the go.
- Automation: Look for tools that can handle repetitive tasks, like auto-follow-ups or enrollment triggers.
- Security: Ensure the platform offers role-based access and robust data protection for sensitive client information.
Tools like Cohoist are built specifically for this environment. They offer a refreshingly simple case management experience that connects intake, service tracking, notes, and reporting in one clean system. By focusing on human-centered design, Cohoist helps teams reduce busywork and gain clearer visibility into their impact, proving why simplicity wins for nonprofits over complex legacy systems.
Next Steps for Better Reporting
Improving your outcome tracking doesn't require a complete overhaul of your operations. It starts with choosing tools that respect your team's time and align with your actual workflows. By automating data collection and visualization, you can turn daily casework into powerful, funder-ready reports with minimal effort.
If you're ready to see how a simpler, more intuitive approach can transform your reporting process, explore the available options. You can start a free trial to test the features firsthand or request a personalized walkthrough to see how it fits your specific needs.
Ready to put this into practice?
Cohoist gives your team clean intake, fast service tracking, and funder-ready reports — without the clutter of traditional systems. See how simple it can be.