Secure AI-Powered Report Builder: Faster Reporting for Human Service Organizations
Reporting shouldn't feel like a second job, but it often does for human service organizations. You spend your day helping clients navigate housing, employment, or health challenges. Then, when grant season or quarterly reviews arrive, you're left scrambling to compile data from spreadsheets, paper files, and disjointed software tabs.
Even if you have a digital system, it often requires manual data entry or complex exports that take hours to prepare. The result? Delayed reports, inconsistent data, and staff burnout.
This guide explains how to build a reporting workflow that supports your mission using modern tools like Cohoist. We will look at how AI-powered report builders work, why security is non-negotiable for sensitive client data, and how to turn everyday casework into funder-ready insights without the busywork.
The Shift from Manual Compilation to Automated Insight
Traditional reporting in human services often relies on retrospective data entry. Staff log services, and months later, an administrator pulls those records to answer a funder's question: "How many clients achieved housing stability?"
This lag creates two major problems:
- Data Decay: Details get forgotten or recorded inconsistently.
- Analysis Paralysis: By the time the report is built, the data may no longer reflect current program needs.
Modern case management platforms have shifted this model. Instead of asking staff to manually aggregate data for reports, these systems capture outcomes in real-time. When a case worker logs a service or updates a client's status, that data is immediately structured and ready for analysis.
The next evolution is AI-assisted visualization. Rather than hiring a data analyst to build complex charts, staff can now use natural language to generate insights. This democratizes data, allowing program managers to answer their own questions instantly.
How Cohoist's AI-Powered Report Builder Works
An AI-powered report builder doesn't replace human judgment; it removes the technical friction of data presentation. It allows you to describe what you need in plain English, and the system translates that request into a visual dashboard.
Cohoist is built specifically for this workflow. It connects intake, service tracking, and reporting in one clean system, ensuring that the data used for reporting is the same data logged by frontline staff.
Here is how the workflow functions in Cohoist:
1. Natural Language Input
You don't need to know SQL or pivot tables. You simply type a question or a description of the insight you need.
- Example: "Show me a pie chart of clients by housing status."
- Example: "Display the number of clients who completed our workforce training over the last six months."
- Example: "Create a bar graph showing how many people we served with each of our food-related services last quarter."
2. Data Resource Mapping
Without sending your client data to the AI model (extremely important!), the system identifies which data fields in your database correspond to your request. It looks at profile questions, program enrollments, assistance types, and outcomes to find the right metrics.
Based on the complexity of your request, you can choose between two different AI modes: Fast and Expert.
- Fast mode provides quick insights for straightforward visualizations requests.
- Expert mode is better suited for more complex queries that require deeper analysis.
3. Instant Visualization Generation
The AI generates a chart or graph based on the mapped data. You can then refine the view, adjust filters, or save it as a permanent part of your dashboard.
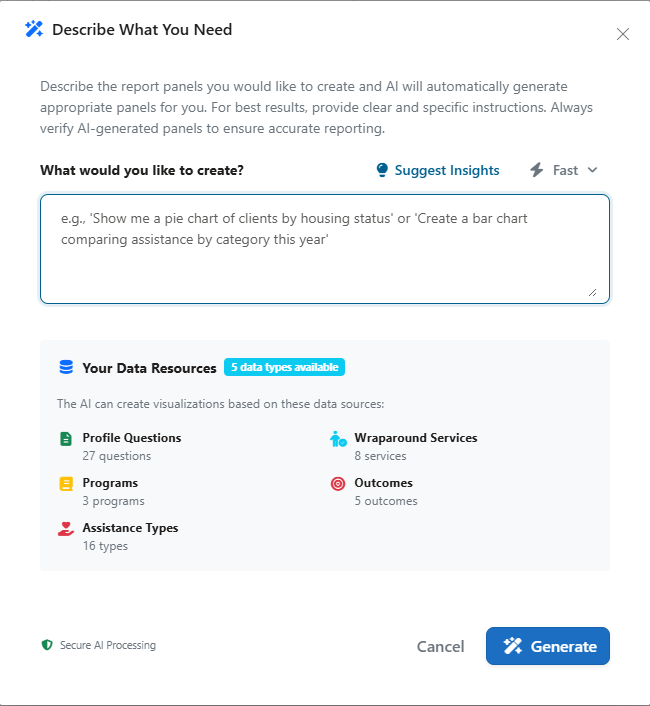
The interface above shows a "Describe What You Need" modal. Users can type natural language prompts, choose different AI modes, and generate visualizations instantly.
This approach drastically reduces the time spent on report creation. What used to take days of manual Excel work can now be done in minutes.
The video below demonstrates how easy it is to generate a report using Cohoist's AI-powered report builder. You can see how a simple natural language prompt transforms into a visual insight without any technical steps.
You can see how the AI model understands the request and generates two relevant charts without any manual data manipulation. This is the future of reporting in human services: intuitive, fast, and accessible to all staff members. The entire goal of Cohoist is to continue our mission of simplifying case management like this so more time can be spent helping others.
Building Custom Dashboards for Specific Program Needs
Not all programs need the same metrics. A workforce development team cares about job placements and employer partnerships, while a housing assistance team focuses on unit occupancy and stability rates.
Cohoist allows you to create custom views for different stakeholders using a flexible, drag-and-drop interface.
Drag-and-Drop Flexibility
You can arrange panels on a dashboard to tell a specific story. For example, you might place a high-level "Clients Served" metric at the top, followed by a breakdown of "Initial Housing Status," and then a chart comparing the dollar amount provided across different assistance types.
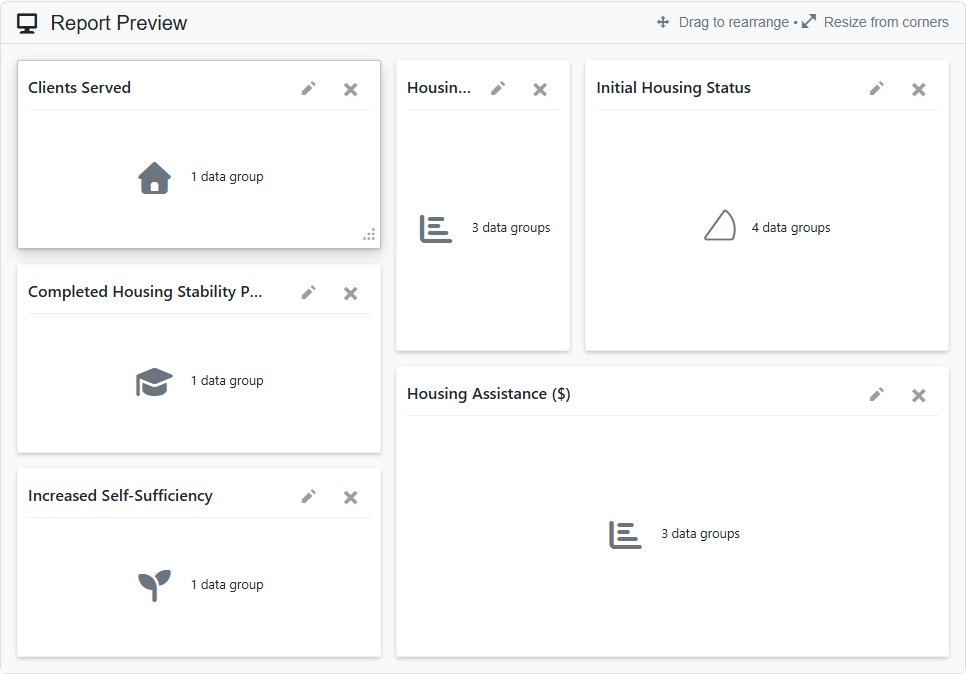
This preview layout demonstrates how users can drag and resize panels to create a custom dashboard. Cards represent specific metrics like "Clients Served," "Initial Housing Status," and "Increased Self-Sufficiency," allowing for a tailored view of program impact.
Mixing Chart Types
Effective reporting uses the right visual for the data.
- Bar Charts: Great for comparing categories (e.g., services by type).
- Pie Charts: Useful for showing proportions (e.g., demographic breakdowns).
- Value Cards: Ideal for tracking key metrics at a glance (e.g., monthly intake numbers).
You can mix these types in a single report to provide a holistic view of your organization's health.
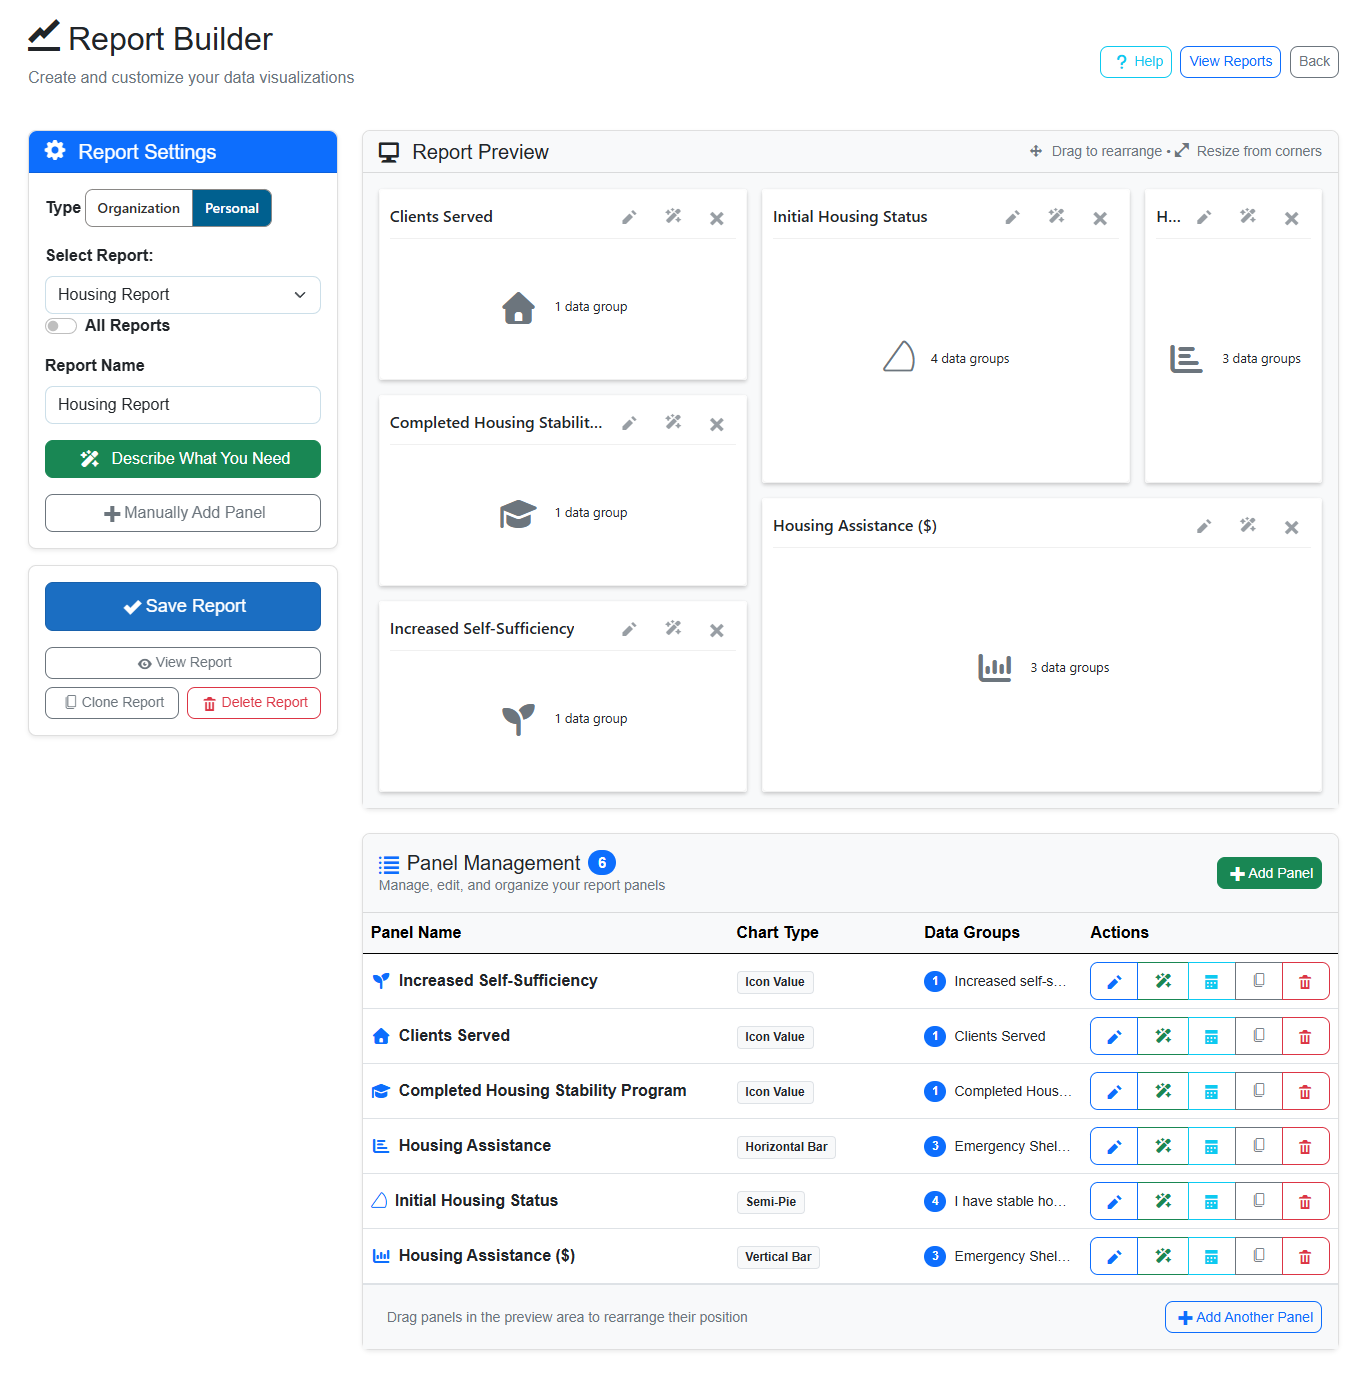
The Report Builder interface allows for both AI-assisted and manual panel creation. The left sidebar lets users configure report settings, while the right side shows a live preview of the dashboard layout, including various chart types like semi-pies and vertical bars.
Security and Privacy: Protecting Client Data
When you introduce AI to your reporting, security is the first concern. Human service organizations handle highly sensitive information, including health records, financial details, and legal statuses.
Cohoist prioritizes strong security, role-based access, and data protection for sensitive client information.
Client data should never be sent to AI models for creating reports. Instead, only your program's metadata (like assistance offerings and intake fields) should be used to generate relevant visualizations. This is exactly how Cohoist's AI Report Builder operates. By keeping client data out of the AI processing loop, you can leverage powerful insights without sacrificing client privacy.
Practical Steps to Implement AI Reporting
If you're considering upgrading your reporting process, here is a practical path forward using Cohoist.
1. Audit Your Current Data
Before building reports, ensure your data is clean. Are you using consistent labels for housing status? Are assistance types standardized and categorized? AI is powerful, but it relies on the quality of the data it ingests. Cohoist's intake forms and organized service tracking help maintain data quality from day one.
2. Start with High-Impact Questions
Identify the top three questions funders or leadership ask most frequently. Build those reports first using the AI builder. This provides immediate value and demonstrates the tool's capability to your team.
3. Train Your Team
Focus on the "describe what you need" workflow. Show staff how to write clear, specific prompts. Encourage them to experiment with different chart types to see what communicates their impact best.
Whereas traditional reporting tools can be complex, time-consuming and require extensive training or practice, Cohoist's refreshingly simple interface means training time is short. Using natural language to generate reports is intuitive, and the AI handles the technical details, allowing staff to focus on insights rather than mechanics.
4. Iterate and Refine
Reporting is not a one-time task. As your program evolves, your metrics will change. Use the drag-and-drop builder to add new panels or remove outdated ones as needed. Cohoist lets you edit existing panels using the same natural language interface, making it easy to keep your dashboards up-to-date with your program's current priorities.
You can also add and edit reports manually, allowing for a blend of AI-generated and custom insights. This flexibility ensures that your reporting can adapt to changing needs without requiring a complete overhaul.
Why Simplicity Wins for Human Services
The best technology is the kind you don't have to fight.
Legacy systems often require extensive training and complex configuration. This creates a barrier to adoption, leading to inconsistent data entry and poor reporting quality.
Modern platforms prioritize human-centered design. They are built to be intuitive, allowing staff to log services quickly and generate reports effortlessly. This reduces administrative burden, letting you focus on what matters: serving your community.
For example, Cohoist connects intake, service tracking, and reporting in one clean system. Its AI-powered dashboard builder allows teams to generate funder-ready reports using natural language, while its role-based security ensures sensitive client data remains protected.
The result is a clearer path from intake to impact, with less busywork for your staff.
Conclusion
We've heard from many human service organizations that reporting is a major pain point. The friction involved in traditional reporting methods can be overwhelming. The good news is that modern tools like Cohoist are making it easier than ever to generate insightful, funder-ready reports without the usual headaches.
That's because reporting is no longer a nice-to-do task; it's become a mandatory tool for demonstrating impact and securing future funding. By leveraging AI-powered report builders, human service organizations can turn their daily casework into actionable insights in minutes, not days.
The key is to choose a solution that prioritizes security, simplicity, and flexibility. When your reporting system is as intuitive as your service delivery, you free up your team to do what they do best: help people thrive.
If you're ready to see how a secure, AI-powered report builder can transform your nonprofit's impact tracking, explore the available options to find the right fit for your team. Start a free trial today to experience faster, more accurate reporting.
Ready to put this into practice?
Cohoist gives your team clean intake, fast service tracking, and funder-ready reports — without the clutter of traditional systems. See how simple it can be.